20 May 2026
Rest Patterns in NBA Back-to-Backs Shift Performance Metrics and Betting Markets
NBA schedules pack teams into consecutive nights more often than fans realize, creating measurable gaps in recovery time that ripple straight into statistical outputs and odds adjustments. Teams facing back-to-backs record lower points per possession on both ends of the floor, while opponents with extra rest post higher effective field goal percentages according to tracking data compiled across multiple seasons. These shifts appear consistently in regular season logs and carry through into postseason windows where travel compounds the fatigue factor.
Schedule Density Creates Clear Performance Gaps
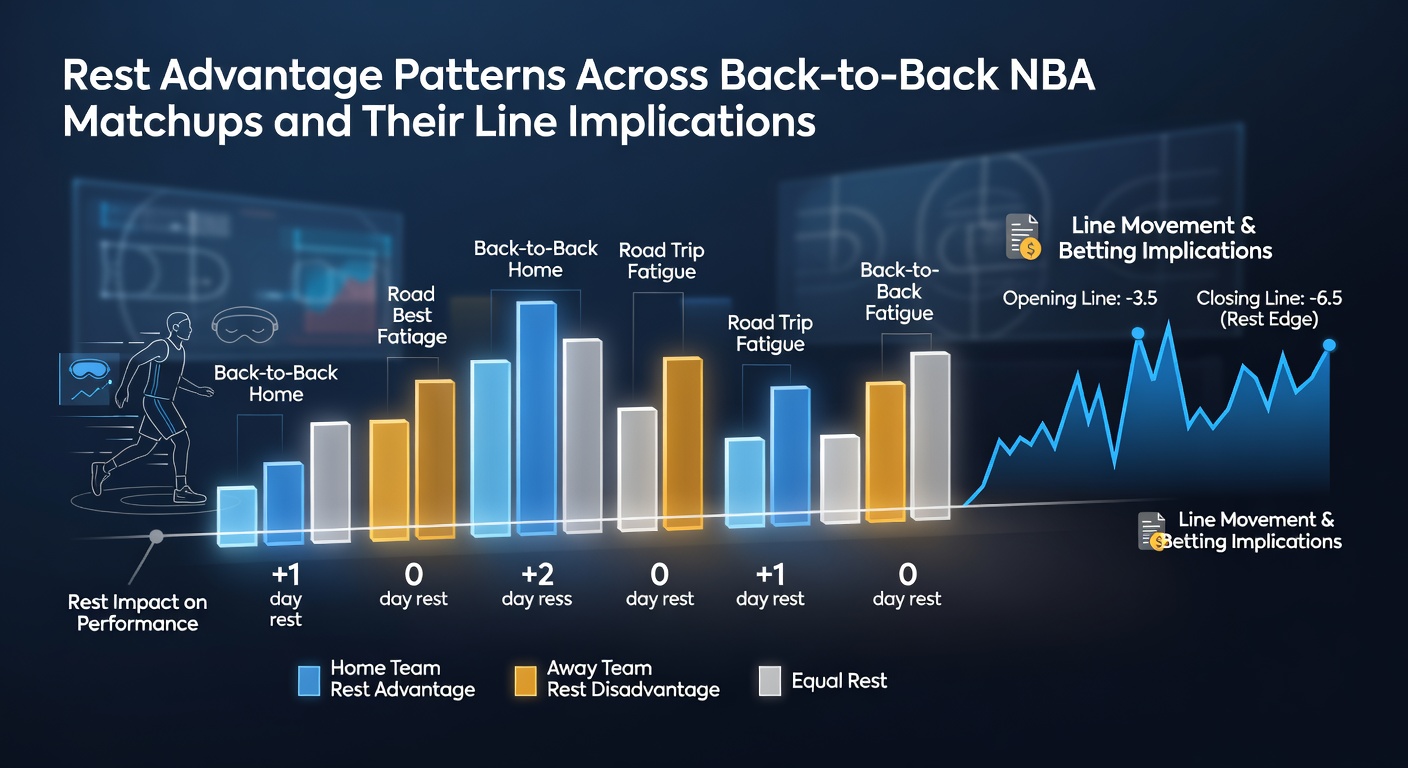
League schedulers balance 82-game slates across all 30 franchises, yet certain clubs absorb clusters of back-to-backs while others receive more spaced fixtures. Data from the 2025-26 campaign shows teams playing the second night of a back-to-back win roughly 4 percentage points less often than when they enjoy at least one full day between contests. Points scored drop by an average of 4.8 per game in those second contests while defensive rating worsens by 3.2 points per 100 possessions, patterns documented in play-by-play archives maintained by major analytics platforms.
Travel distance adds another layer. Clubs crossing multiple time zones before a back-to-back see their turnover rates climb further, whereas teams staying within the same region maintain closer to baseline efficiency numbers. Observers tracking these variables note that Western Conference squads encounter more cross-country trips during heavy schedule stretches compared with Eastern Conference counterparts.
Betting Lines Adjust to Quantified Rest Edges
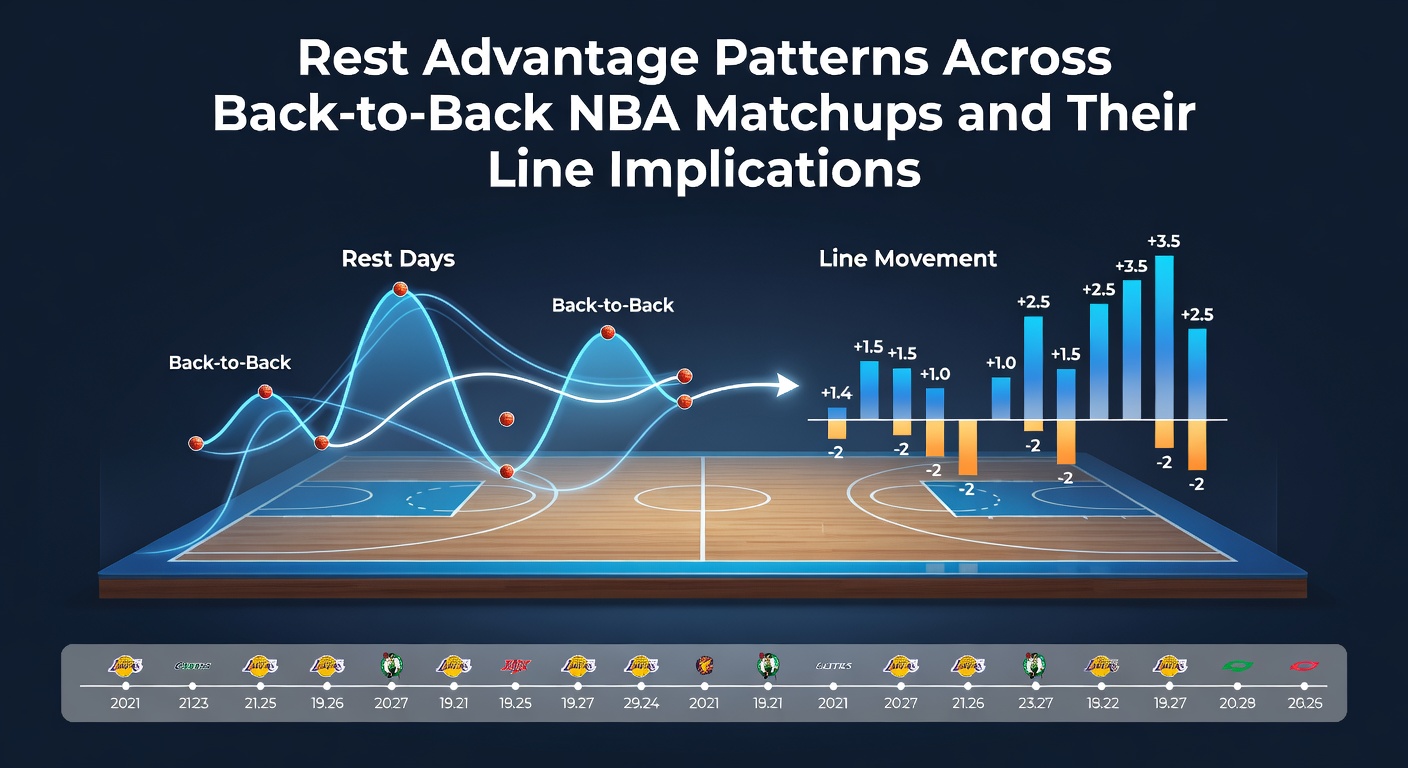
Oddsmakers incorporate rest differentials directly into opening numbers, typically shading spreads between 1.5 and 3 points when one side arrives with an extra day of preparation. Totals also move lower when both clubs enter on short rest because combined scoring averages decline by nearly five points under those conditions. Historical closing line data reveals that sides receiving rest cover the adjusted spread at a 52.8 percent clip over the past five seasons, a margin that holds after accounting for home-court effects.
Line movement accelerates once injury reports surface on the morning of the second game. Starters logging heavy minutes the prior evening frequently receive reduced roles, prompting bettors to push totals downward while sportsbooks respond by tightening the number further. This feedback loop repeats across major sportsbooks and creates observable patterns in live betting windows.
Playoff and Late-Season Implications Surface in 2026
As the 2025-26 regular season winds down in May 2026, teams jockeying for seeding often face compressed schedules that amplify rest disparities. Contenders resting key rotation players on the second night of back-to-backs see their offensive efficiency dip measurably, while lottery-bound clubs sometimes treat those games as evaluation opportunities rather than win-maximization efforts. These motivations alter expected margins and prompt further line tweaks from oddsmakers monitoring motivational factors alongside physical recovery data.
Researchers examining postseason series note that teams entering a playoff round after multiple back-to-backs during the regular season finale adjust their rotation minutes more aggressively in early games. This strategic shift stabilizes performance metrics but rarely erases the underlying efficiency gap entirely, leaving measurable edges for totals and player prop markets.
Case Examples Highlight Recurring Trends
One Western Conference club during the 2024-25 stretch absorbed five back-to-backs in a 12-day window and posted a 2-8 record in the second game of each pair, with scoring margins widening by an average of six points against rested opponents. Another Eastern Conference squad limited starters to under 28 minutes on the second night and maintained closer results, illustrating how coaching adjustments interact with rest variables to shape final outcomes and subsequent line reactions.
Those patterns repeat because recovery physiology remains constant even as personnel changes. Muscle glycogen replenishment and sleep quality metrics tracked by team medical staffs correlate directly with second-night shooting percentages and defensive closeout speeds, giving quantitative backing to the observed statistical declines.
Conclusion
Rest differentials embedded in the NBA schedule produce repeatable effects on team efficiency, scoring volume, and game margins that sportsbooks translate into adjusted lines across spreads and totals. Data accumulated over recent seasons confirms these relationships persist into late-season and playoff environments, where May 2026 scheduling clusters will again test how clubs manage recovery windows against market expectations shaped by the same variables.